Phonon Junction Explorer (PhononViz)
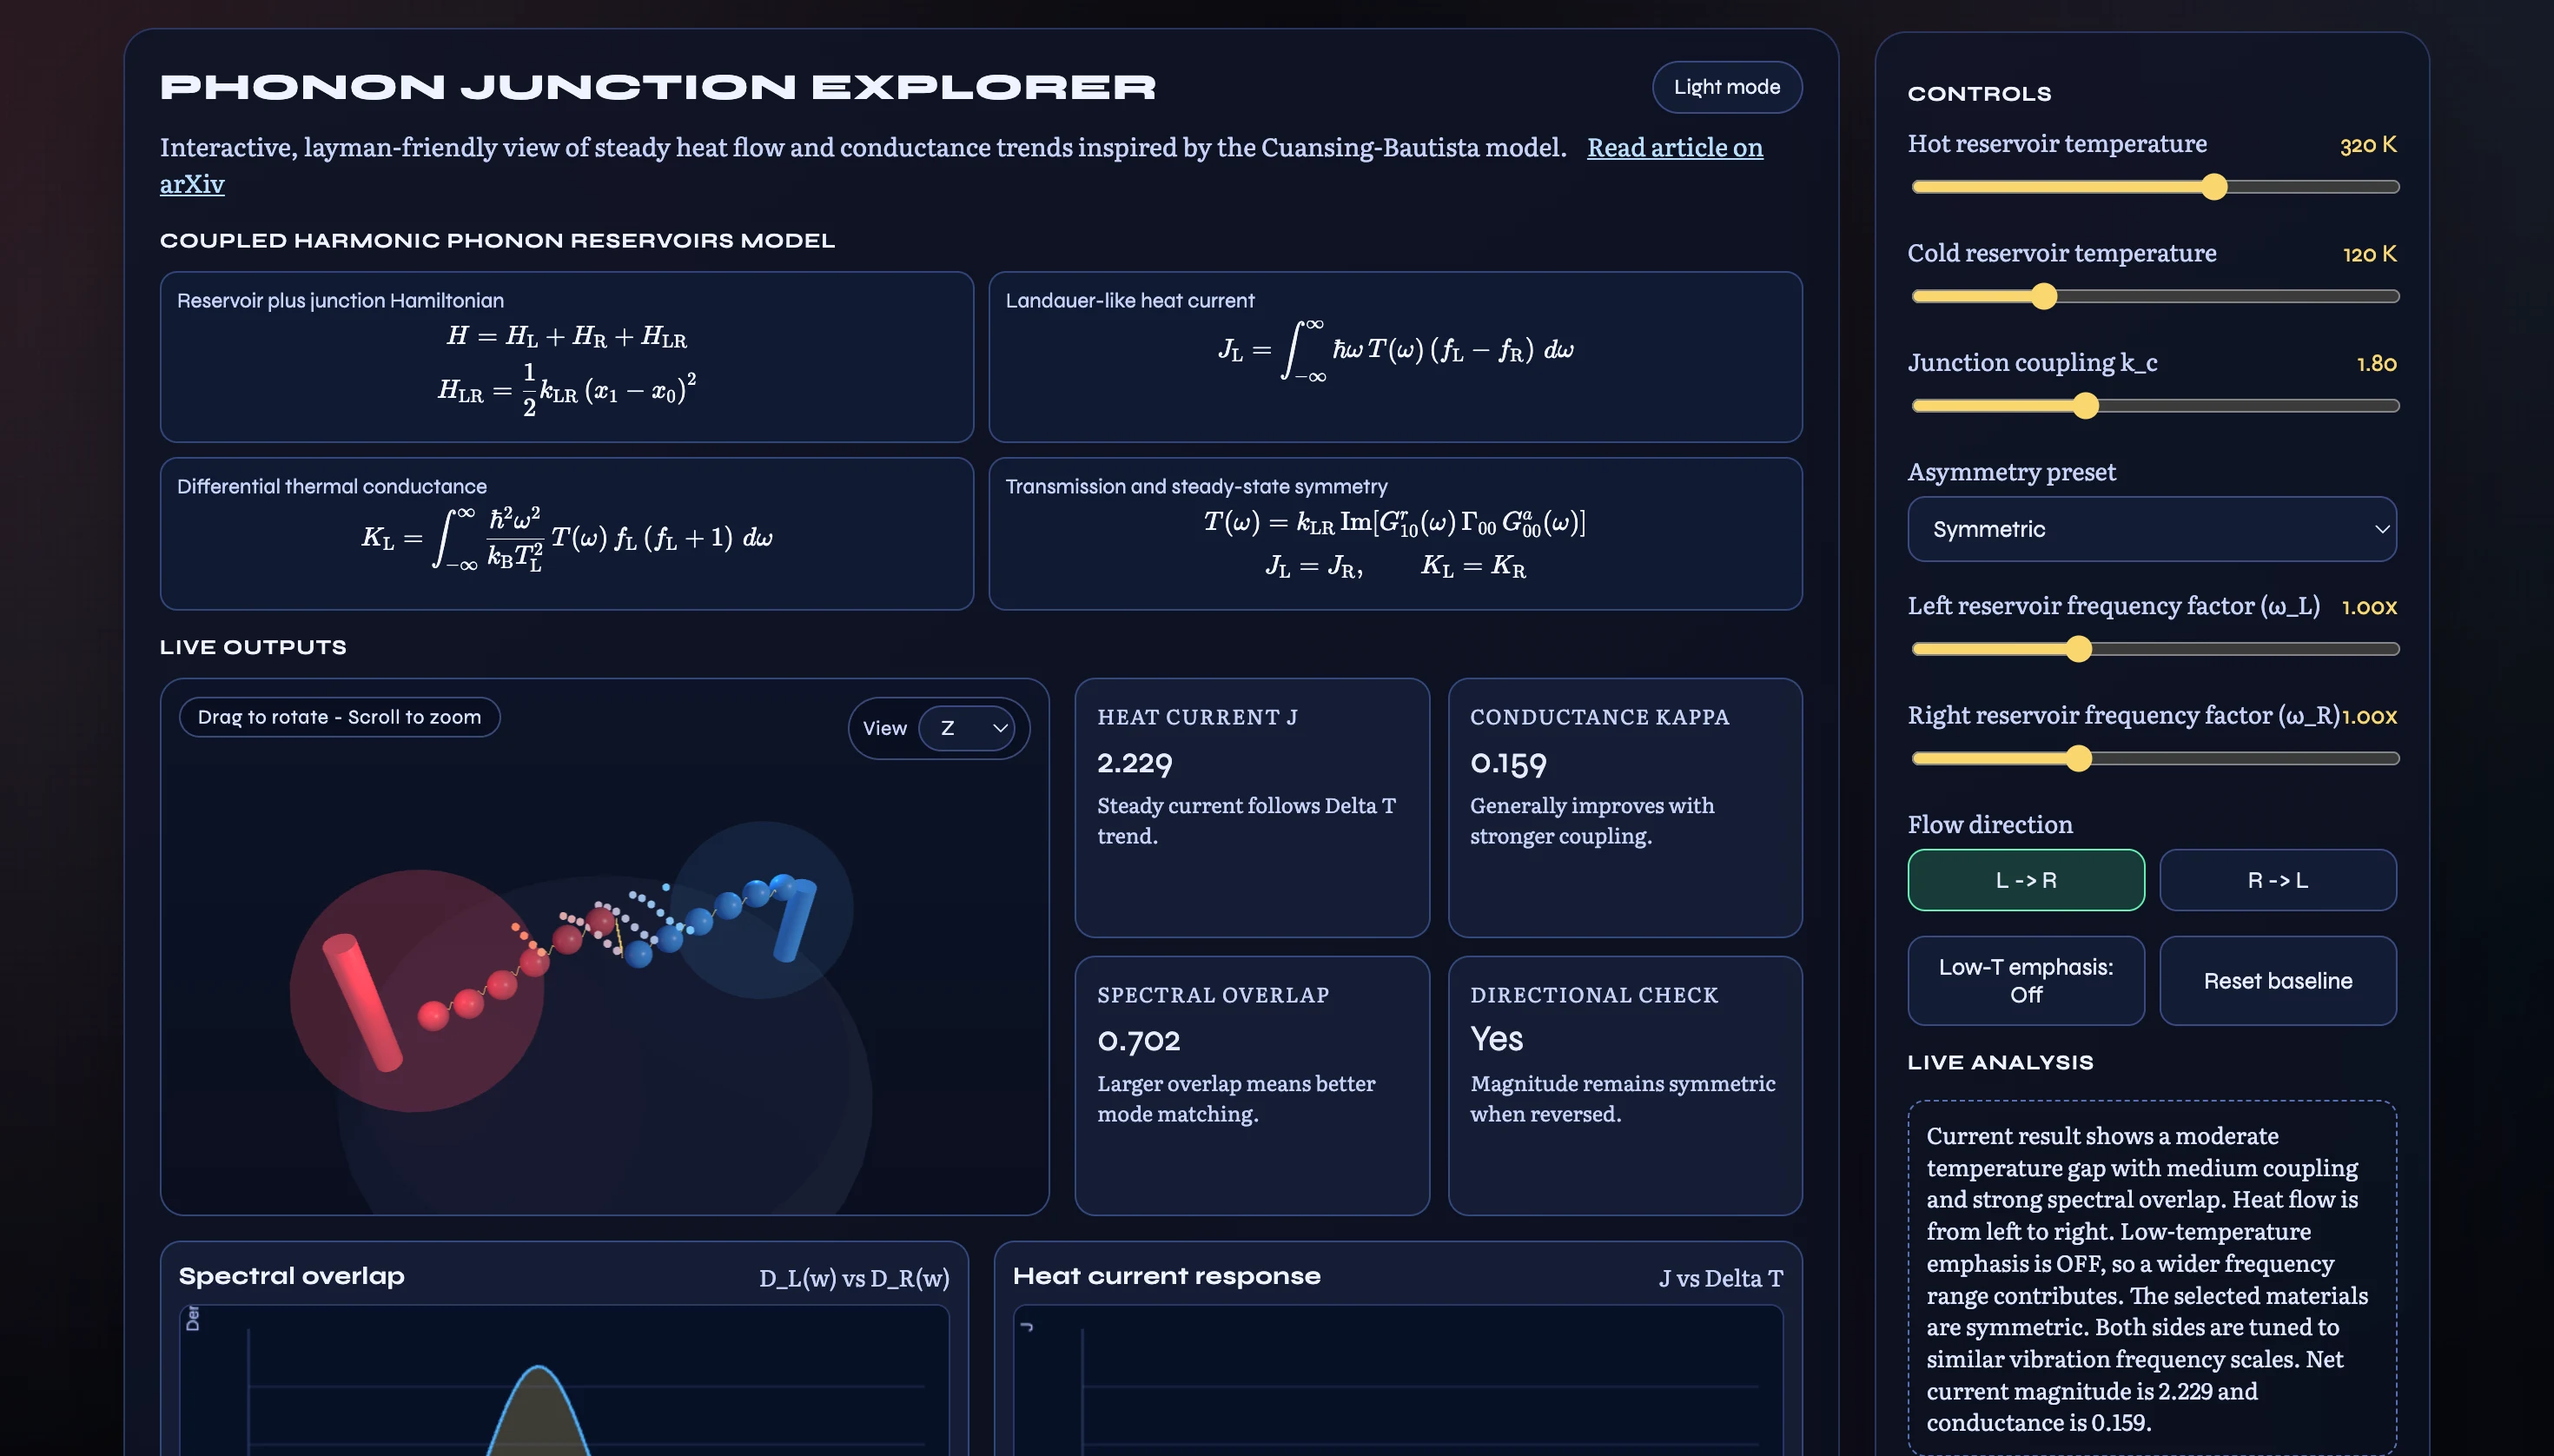
Built this interactive Phonon Junction Explorer to help make Dr. Eduardo Cuansing and Rafael Bautista's latest arXiv paper more intuitive: it combines LaTeX-rendered equations, a 3D animated junction view, live transport charts, and interactive controls (temperature, coupling, asymmetry, direction, and frequency factors) so you can see theory and behavior update together in real time.
- Live app: wencano.com/phononviz
- Source: github.com/wencano/phononviz
- Paper: Steady-state phonon heat currents and differential thermal conductance across a junction of two harmonic phonon reservoirs
Problem
Advanced transport papers are often hard to absorb for non-specialists because equations, assumptions, and outcomes are separated across sections and static figures. Readers need a way to connect the math to behavior without manually re-deriving each parameter change.
Solution
Create an explorable interface where equations and simulation behavior stay in sync:
- Render equations clearly in-browser with LaTeX support.
- Use a 3D junction visualization to communicate system structure.
- Plot transport behavior in live-updating charts.
- Expose the key parameters so readers can test intuition quickly.
Impact
- Makes the paper easier to discuss in classes, labs, and demos.
- Helps bridge theoretical expressions with observable trends.
- Speeds up exploratory learning for readers and collaborators.
Lessons learned
- Scientific interfaces benefit from showing equations + visuals + controls together.
- Tight feedback loops make complex domains feel approachable.
- Building this reminded me how my undergrad thesis took months to implement a similar interactive interface from scratch, while modern tooling now enables early prototypes in minutes.
Tech stack
- Frontend: Vanilla JavaScript, HTML, and CSS (no framework)
- Visualization: 3D scene + charting workflow for transport behavior
- Math rendering: LaTeX in-browser equation display